

5 Fundamental Metrics to Pick Stocks
5 Fundamental Metrics to Pick Stocks
"Investing should be more like watching paint dry or watching grass grow. If you want excitement, take $800 and go to Las Vegas." — Paul Samuelson

In a changing world, data shapes every business decision — and investing is no exception. But amidst all the noise, it’s hard to find the signal. So where should we focus as investors? In this post, we’ll explore some of the most relevant metrics to pick stocks.

1. Return on Equity (ROE)
ROE measures a business efficiency in making money. It compares its net income to its equity — assets minus liabilities. If a business has $1,000,000 worth of equity and it makes a net income of $200,000, its ROE stands at 20%. For every $1 of equity, it’s made $0.20 in profit. But this is just a snapshot — you should always look at trends. Good businesses have constant ROEs and great businesses have increasing ROEs. AAPL 0.00%↑ ROE over time, for example, is terrific.

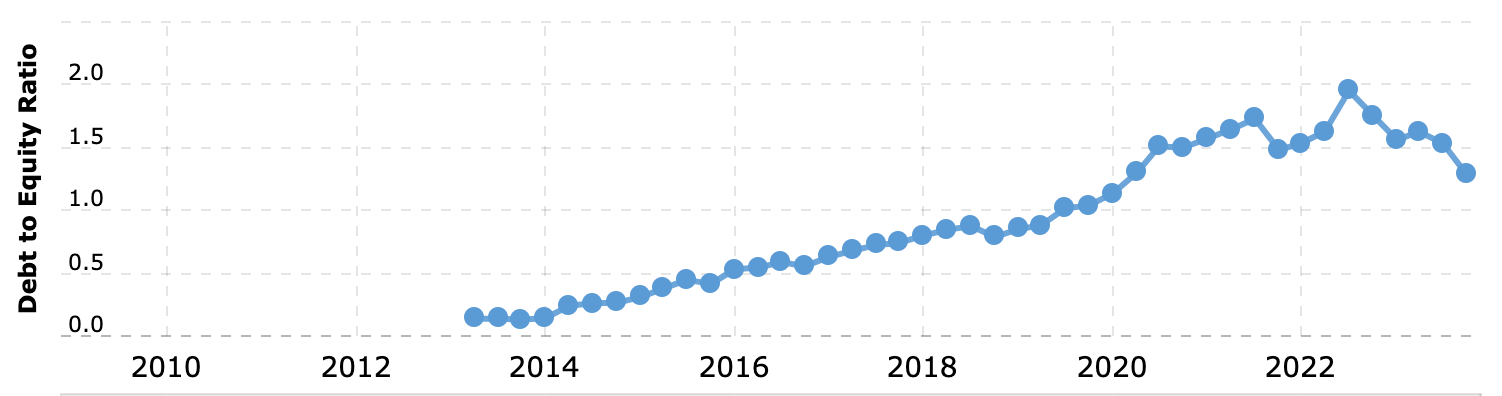
2. Debt-to-Equity ratio (D/E)
Some leverage is good to speeds things up. Too much can lead to bankruptcy. The debt-to-equity ratio measures a company's financial leverage by comparing its total debt to its equity. A lower ratio indicates a company is less risky. But if this number is too low, the management team may be missing out on growth opportunities. High debt levels can burden a company with interest payments, but it’s not always that bad. Warren Buffet prefers companies with a D/E of ~ 0.5 or less. Yet his holdings of AAPL 0.00%↑ evince he’s flexible on this metric. Here’s the Debt-to-Equity ratio for the iPhone maker:
3. Price-to-Earnings Ratio (P/E)
Take the earnings of a company and divide it by the number of all the outstanding shares. Now you have the Earnings per Share (EPS). This number tells us how much money a company makes per share.
Now take the price of a stock and divide it by the EPS. That’s the P/E ratio. It indicates how much investors are willing to pay per every dollar of earnings. A lower P/E ratio might suggest that a stock is undervalued, while a higher P/E ratio might indicate overvaluation. However, it's essential to compare P/E ratios within the same industry or against historical averages for context.
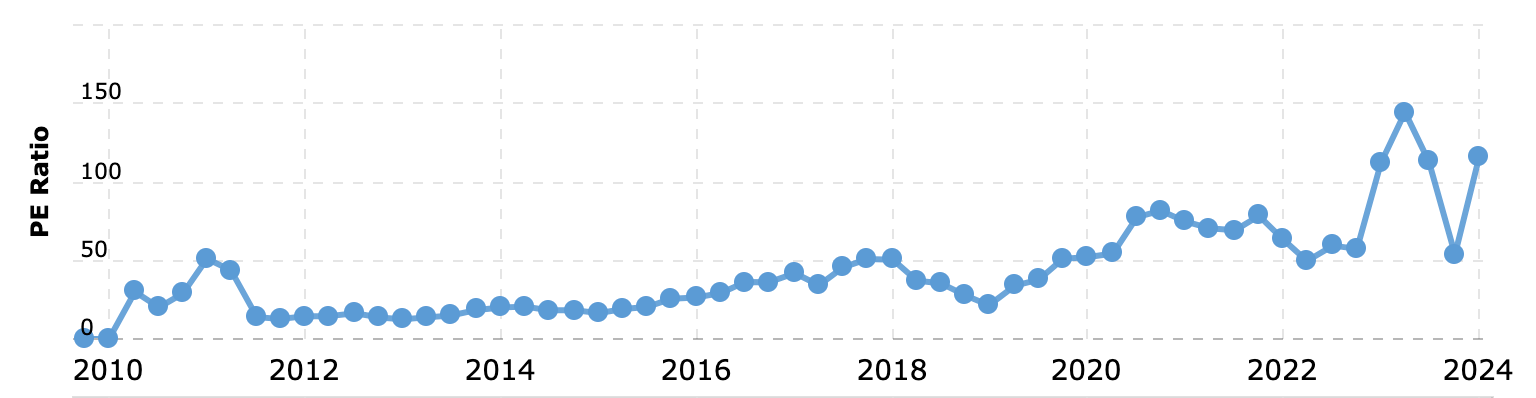
Here’s NVDA 0.00%↑ PE ratio. Despite its astronomic returns in the last few months, the chip maker giant has managed to decrease it as compared to 12 months ago. Now it sits at 114.47, which is absurdly high. People who buy now will be paying $114.47 for every $1 of earnings.
4. Price-to-Book Ratio (P/B)
Every company has two types of valuations: the market value, and the accounting value. The market value refers to the value all market participants assign to a company. That’s the sum of the value of all outstanding shares. The market value is an agreement. The book value, on the other hand, is a simple formula: assets minus liabilities. Comparing these two numbers proves helpful when picking stocks. And we often do it on a per share basis.
The price-to-book ratio compares a company's market value (share price) to its book value (assets minus liabilities). It provides insight into whether a stock is trading at a premium or discount relative to its accounting value. A low P/B ratio could indicate an undervalued stock, while a high ratio might suggest overvaluation. However, like other metrics, it's crucial to consider industry norms and company specifics. Tech companies, for example, tend to have low book values, because they don’t have any tangible assets.
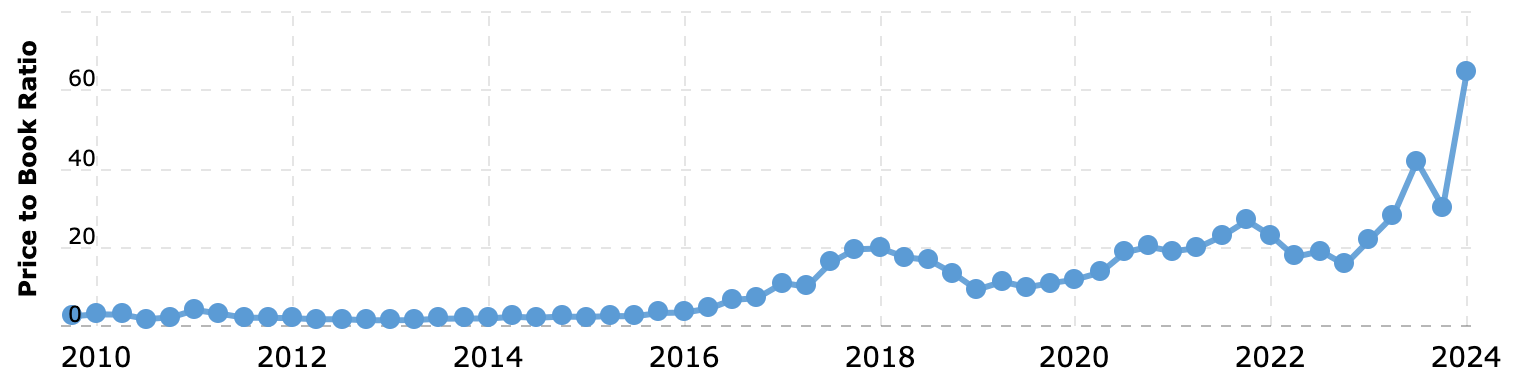
Here’s NVDA 0.00%↑ P/B ratio, which stands at 64.89. This means that investors buying at this price will be paying $64.89 for every $1 of equity. Doesn’t sound like a good deal, right?
5. Interest Coverage Ratio
The D/E ratio told us how much debt a company had. The interest coverage ratio measures a company's ability to handle its debt. Especially its interest payments. To calculate it, take the earnings before interest and taxes (EBIT) and divide it by its interest expense.
Here’s an example from Investopedia:
Suppose that a company’s earnings during a given quarter are $625,000 and that it has debts upon which it is liable for payments of $30,000 every month. To calculate the interest coverage ratio here, one would need to convert the monthly interest payments into quarterly payments by multiplying them by three (the remaining quarters in the calendar year). The interest coverage ratio for the company is $625,000 / $90,000 ($30,000 x 3) = 6.94. This indicates the company has no current problems with liquidity.
This ratio is also called Times Interest Earned (TIE). Because it tells us how many times a company could cover its interest expense with its earnings. Investors should choose companies with TIEs above 1.5.
We saw that Apple is more leveraged than what value investors would prefer. But its interest coverage ratio is 40.5, meaning they could handle 40.5 times as much interest expenses as they have now.
What other metrics do you use to pick stocks?
Photo of the week
I didn’t take any picture this week, but here’s one from last December. Coimbra, a charming city in Portugal, known for having one of the oldest universities in Europe.

Alejandro López — The Psychology of Wealth
A lot of these are great but I admit I’ve never been a fan of equity based metrics (D/E, ROE, P/B) or asset based ones (ROA). I find they can be wonky from M&A or accounting treatment. They’re also backwards looking and penalize growth.
Like, the P/B you show for NVDA (65x) makes it look ridiculously expensive, compared to say MSFT at like ~13x. But MSFT and NVDA trade at forward P/Es of 31x and 34x respectively.